
Tagada
tagada – Task dAg GenerAtor Doubtful Acronym
This tool generates random task graphs (precisely, Direct Acyclic Graphs, DAG). The Typical usage is to provide test cases for mapping and scheduling algorithms.
Installation
The distribution is avalaible on Gricad-Gitlab.
From sources
Compiling requires an opam based OCaml environment. Recommanded opam version: 2.1. Recommanded OCaml switch (version) >= 4.14 Mandatory packages:
- dune >= 3.0
- yaml >= 3.0
Binary
A Linux-x86_64 binary is provided in the distribution. See ‘BINARY.md’ for detail on system and dynamic lib dependencies.
Usage
tagada generates random task graphs decorated with numerical information. The interpretation (and unit) of these values is up to the user. Nodes (tasks) are decorated with 2 integers:
- a wcet (Worst Case Exec Time)
- a memory footprint (for instance) Edges are decorated with a single integer which is supposed to measure the “width” of the communication (e.g. amount of data, transmission delay etc.).
Type:
tagada -help
for the full option list
Example
tagada -s 100 -pratio 40 -w 10000 -ms [100,200] -t dotx -seed 42 mydag
Generates a random DAG called mydag:
-s 100: with 100 tasks,-pratio 40: whose ratio sequence/parallel is around 40%,-w 10000: where the critical path has a cumulated WCET of about 10000 units,-ms 100 200: the memory footprint of each task is between 100 and 200 units,-t dotx: the output file is “mydag.dot”, in DOT format (graphviz), eXtended (all numerical info displayed in the labels).-seed 42: uses the given seed for random, ensures that the result is deterministic (for these ARGUMENTS and this VERSION of the command).
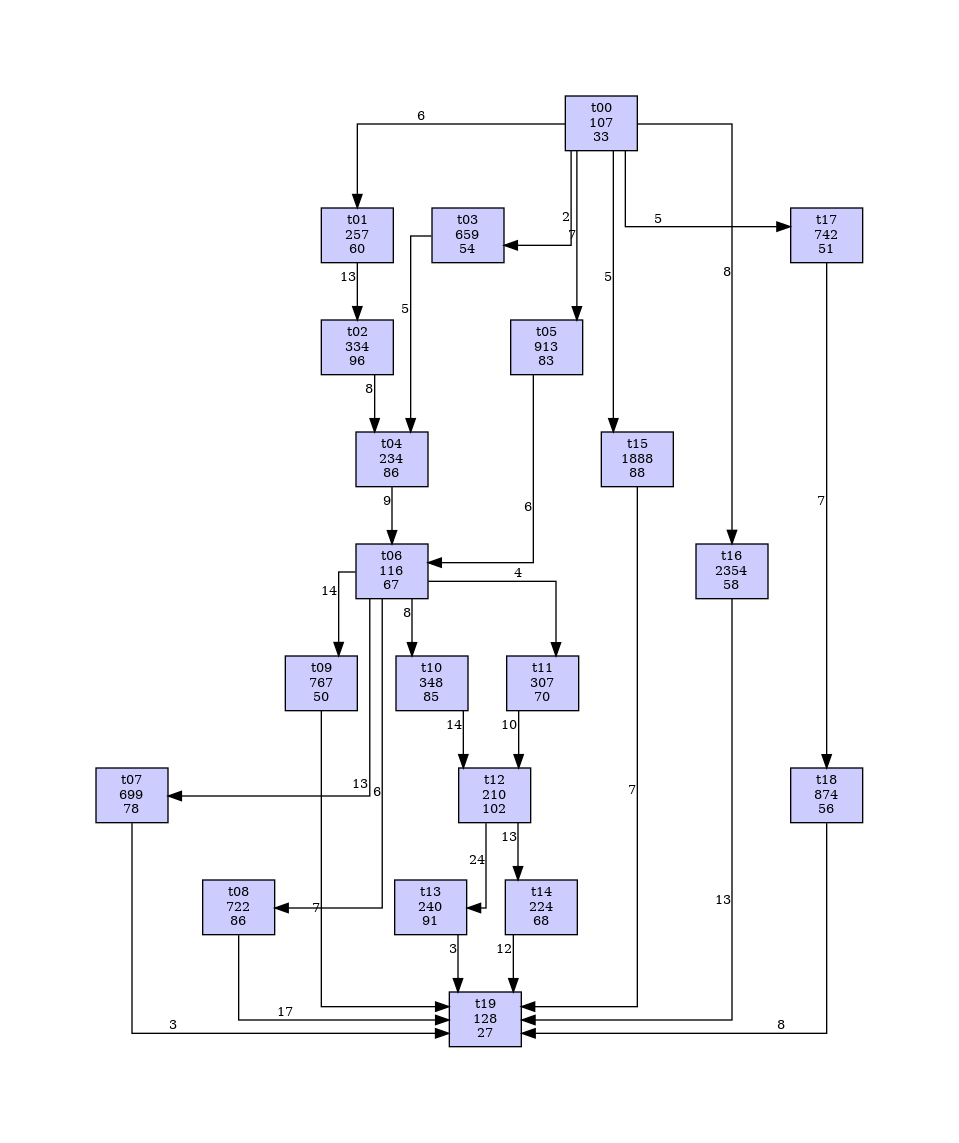
tagada -s 20 -pratio 80 -t dotx -seed 24 tinydag
Generates a smaller graph, with default values for non-specified parameters.
Output formats
MIA’s YAML
tagada was originally written to provide test cases for a specific tool, called MIA Multi-core interference Analysis, this is why the default graph format is the one accepted by this tool (formated in YAML).
Graphviz’ DOT
Since MIA’s YAML is very specific and concerns a few people, this format has been chosen as a simple and “universal” language to describe graph structures. The generated dot file is, in purpose, free of any display/layout directive. Thus the default conversion to graphics with the dot command (Graphviz), produces rather ugly result.
To obtain nice images with dot, it is necessary to customize input file, e.g., with gvpr (from Graphviz). A script is provided (utils/dot2png) as an example of what can be done with Graphviz tools. Here is the image produced for tinydag.dot:
In order to generate nicer layouts (e.g., better positioning of endpoints anchor), one may consider using alternative tools (see below).
yEd’s graphml (indirectly)
yEd (by yWorks) is a commercial tool, free for personal usage. It is a good solution for displaying and printing nice graphs (good automatic layout, look customization). DOT format is not supported natively, but it exists a program that translate dot into “graphml” (the XML-based input format of yEd):
A shell script is provided (utils/dot2graph) in the distribution to ease the use of dottoxml for dot files generated by tagada. I personnaly use the “hierarchical layout” to obtain nice graphs.

Support
Pascal.Raymond@univ-grenoble-alpes.fr
Roadmap
- make installation easier using opam libraries repository
- Windows port, should be possible with the next version of opam (V3).
Authors and acknowledgment
Pascal Raymond
Many thanks to Matheus Schuh, Claire Maiza, Matheus Schuh and Joel Goosens.